.png?width=700&height=127&name=Blue%20Mantis%20formerly%20known%20as%20SME%20Solutions%20Group%2c%20Inc.%20(GREEN).png "Blue Mantis formerly known as SME Solutions Group, Inc.")
Call centers can be the key to high customer satisfaction but with disparate data sources it is difficult to see the complete picture behind service levels. With vast amounts of data being constantly pulled from multiple data sources it can be hard to accurately predict and optimize operations without Business Intelligence.
In this blog, we are going to discuss:
- Challenges Call Centers are Facing
- Executive Dashboards
- Agent Performance
- Customer Service
- Insights & Storytelling
Challenges
Amidst the ever-evolving landscape of customer service and customer experience, call centers are facing various obstacles that demand strategic resolutions. With the increasing demand for seamless and personalized customer interactions, call centers must adeptly navigate through complex challenges to uphold their competitive advantage. While call centers are persistently working towards measuring and enhancing their service standards, the hurdle lies in the absence of a centralized platform for collecting and analyzing pertinent service metrics. Without a unified approach to assessing these metrics and ensuring data accuracy and integrity, valuable insights could be lost or misinterpreted, resulting in missed opportunities to elevate customer satisfaction and operational efficiency. Here are the top 3 challenges currently confronting call centers:
- Delivering Consistent Customer Service
Ensuring consistent and high-quality customer service is a constant battle for call centers. With customers expecting swift resolutions and personalized experiences, call centers must empower their agents to handle a wide range of inquiries effectively. This requires robust training programs, real-time performance monitoring, and the implementation of advanced technologies like executive dashboards.
2. Optimizing Agent Performance
Call center agents are the backbone of customer service, and their performance directly impacts the overall customer experience. Monitoring and improving agent productivity, adherence to service-level agreements (SLAs), and customer satisfaction metrics are crucial. Leveraging agent performance dashboards can provide valuable insights to identify training gaps, streamline workflows, and foster a culture of accountability.
3. Harnessing Data-Driven Insights
In the age of digital transformation, call centers are inundated with vast amounts of data from various sources. Effectively analyzing and translating this data into actionable insights is a significant challenge. Implementing robust call center reporting and analytics solutions can help call centers uncover trends, predict customer behavior, and make data-driven decisions to enhance operational efficiency and customer satisfaction.
To overcome these obstacles, call centers need to embrace a comprehensive approach that integrates cutting-edge business intelligence technologies, data-informed decision-making, and a customer-centric mindset. By tackling these critical challenges head-on, call centers can establish themselves as strategic allies in delivering outstanding customer experiences and fostering long-term business success.
Accurately measuring and assessing service performance is essential for the effective functioning of call center operations. Through the implementation of a streamlined process for monitoring and analyzing service metrics, call centers can uncover hidden trends, pinpoint areas for enhancement, and make informed decisions to elevate service quality. Without a cohesive data strategy in place, the full potential of the data remains untapped, leading to potential oversights in interpreting performance indicators that drive customer satisfaction and operational excellence.

Key Initiative: Executive Dashboard
One of our trusted technology partners, Qlik, has been the data analytics tool of choice for many of our customers. With Qlik, we seamlessly integrate disparate data sources to create comprehensive dashboards that serve as the backbone for tracking key metrics and maintaining an overall SLA score. By incorporating a combination of KPIs, dynamic visualizations, and cutting-edge geospatial technology, we are able to extract valuable insights from the data, providing a real-time, holistic view of call center performance.
For instance, consider the scenario of one of SME's utility clients leveraging advanced business analytics tools to identify customers who have reached out multiple times for the same issue. Through the dashboard's automated prioritization feature, these repetitive cases are highlighted, enabling swift action and resolution. This proactive approach was previously unattainable, as there was no efficient method to distinguish between new inquiries and recurring requests.
This seamless integration of data sources and visualization capabilities not only enhances operational efficiency but also empowers organizations to proactively address customer needs and optimize service delivery. The ability to prioritize and address recurring issues promptly leads to improved customer satisfaction and loyalty, ultimately driving business success in the competitive call center industry.
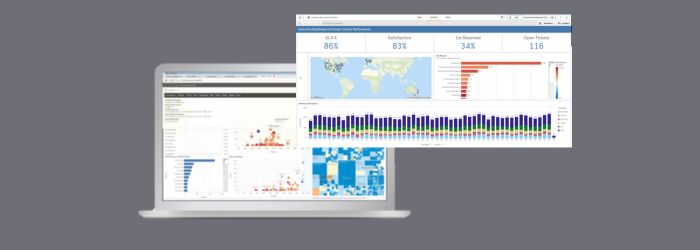
Pictured below an example of a Contact Center Performance Executive Dashboard.

Key Initiative: Improved Customer Service
Resolving severe customer service tickets is paramount in maintaining high satisfaction scores, and having the ability to quickly refine searches across an entire dashboard is essential. With Qlik's powerful Associative Engine, data is seamlessly integrated for real-time analysis, allowing for instant insights into key drivers behind high-priority tickets. By dynamically filtering data fields, every aspect of the analytic dashboards is updated, enabling a swift and efficient identification of trends to streamline the resolution process and ultimately enhance customer satisfaction levels. Moreover, the feature of bookmarking specific selections ensures that users can easily revisit customized filters tailored to their specific needs, providing a focused and personalized approach without altering any underlying data. This user-friendly functionality not only facilitates a more effective and targeted analysis but also contributes to a seamless and personalized user experience, ultimately leading to increased customer satisfaction and improved service quality.
An account manager can drill down to his/her accounts to ensure proper service has been provided. Create bookmarks so that each time the dashboard is revisited, his/her responsible accounts are readily visible.

Key Initiative: Agent Performance
When it comes to evaluating agent performance in call centers, a myriad of metrics are typically taken into consideration. However, the process of analyzing and visualizing these metrics in a comprehensive manner can often be daunting and time-consuming, especially for individuals who may not have a strong background in data analysis. This is where self-service dashboards come into play, revolutionizing the way data is explored and understood across all skill levels.
By leveraging tools such as Qlik, with its cognitive engine and Master Items, users are empowered to effortlessly create and reuse standardized metrics, promoting consistency in data analysis and fostering collaboration within the organization. The advanced capabilities of many analytics tools provide users with augmented intelligence and insightful chart suggestions, simplifying the process of designing personalized and effective dashboards. This seamless integration of features enhances decision-making processes and ultimately contributes to improved performance and success in the call center environment.
In today's fast-paced and data-driven environment, having the ability to effortlessly navigate and interpret complex data sets is crucial for driving operational efficiency and maximizing performance. With self-service dashboards and tools like Qlik or PowerBI, users can unlock the full potential of their data, making informed decisions that lead to improved agent performance and overall call center success.

Key Initiative: Insights & Data Storytelling
Call center dashboards not only identify performance trends but also provide valuable insights into the most common reasons for service tickets, trends in call volume, and overall call center performance.
For instance, our analysis of sample data revealed that March was the lowest performing month, with a direct correlation between the low service level and a significantly higher percentage of unanswered calls compared to other months. Additionally, Saturdays were found to have the highest call volume but also exhibited the lowest service quality. Armed with this information, a department manager can now make informed decisions when allocating human resources and labor budgets to optimize service delivery and enhance customer satisfaction levels.
While finding insights is crucial, sharing these insights effectively is equally important. Traditional PowerPoint presentations are limited in capturing dynamic data that evolves rapidly, such as open ticket volume. However, there are several tools with built-in capabilities, to streamline this. For example, users can create living presentations by embedding entire dashboards that refresh data based on a defined schedule. This interactive approach allows for the full functionality of dashboards to be experienced in presentations, including selections, filters, and drill-downs. By harnessing the power of storytelling through data visualization, users can ensure that no valuable insights are missed and that data-driven decisions are made efficiently.
.png?width=600&name=Untitled%20design%20(65).png)
Solution Overview
A comprehensive data analytics solution for a call center not only integrates multiple data sources but also provides in-depth analysis and insights into call center performance metrics.
With cutting-edge technology and expert guidance, our advanced data solutions streamline the tracking of key performance indicators, pinpointing areas for enhancement and enabling data-driven decisions to elevate overall service quality. Through in-depth training sessions, we equip staff with the necessary skills to navigate the platform effortlessly, fostering a culture of data-driven decision-making within the organization.
We don't leave when the solution is simply implemented, we stay on and provide ongoing support for user adoption, offering guidance to help users maximize the value of the analytics solution. By actively engaging with users and addressing challenges, we ensure a seamless transition to the new system, integrating data analytics into daily operations.
The implementation of a cutting-edge data analytics solution, coupled with thorough training and ongoing support, has been instrumental in catalyzing positive transformations for call centers. By optimizing performance and ultimately enhancing customer satisfaction levels, this innovative approach, integrated with an executive dashboard that evaluates overall service levels and identifies areas for improvement based on historical data analysis, has proven to be a game-changer in driving operational excellence.
If you would like to learn more about advanced data solutions and how automating performance measurements can transform a culture about service tickets to a culture about service quality, email us at info@smesgroup.com.